
Various trading strategies are used by traders in order to earn profit with capital. Having a trading strategy will allow you to both plan all of your trading activities and answer the questions you need to ask before making a decision. For example, what underlying asset should you trade? When should you buy in and sell out of the underlying asset? If the price moves in a negative direction, what should you do to cut your losses? Which indicators should you follow to open or close a position?
Once you put those trading plans in place, you have the tools needed to build a flourishing trading system, which could develop into a sound strategy over time. In general, there are three trading strategies used by traders: technical analysis (TA), fundamental analysis (FA), and event-driven analysis (EDA).
Technical analysis is often a great starting point for beginners since traders often need to have a more nuanced understanding of the markets to analyze the fundamental data and logic behind market events. As a result, this article will focus on TA and introduce some basic strategies to follow.
EMA Trading Strategy
The EMA (exponential moving average) is one of the most popular trading indicators used by traders and is perhaps the oldest form of technical analysis. The EMA trading strategy provides the support and resistance level, while also identifying the predominant trend in the market. It is especially effective when the macro environment is in a bull or bear trend.
The EMA is a line on the price chart that shows the average price over a certain period of time and uses a mathematical formula to account for the price action. The EMA formula puts more weight on the recent price, which means it is more reliable, as it reacts faster to the latest changes in price data and is more sensitive than an MA line (to be discussed at a later time).
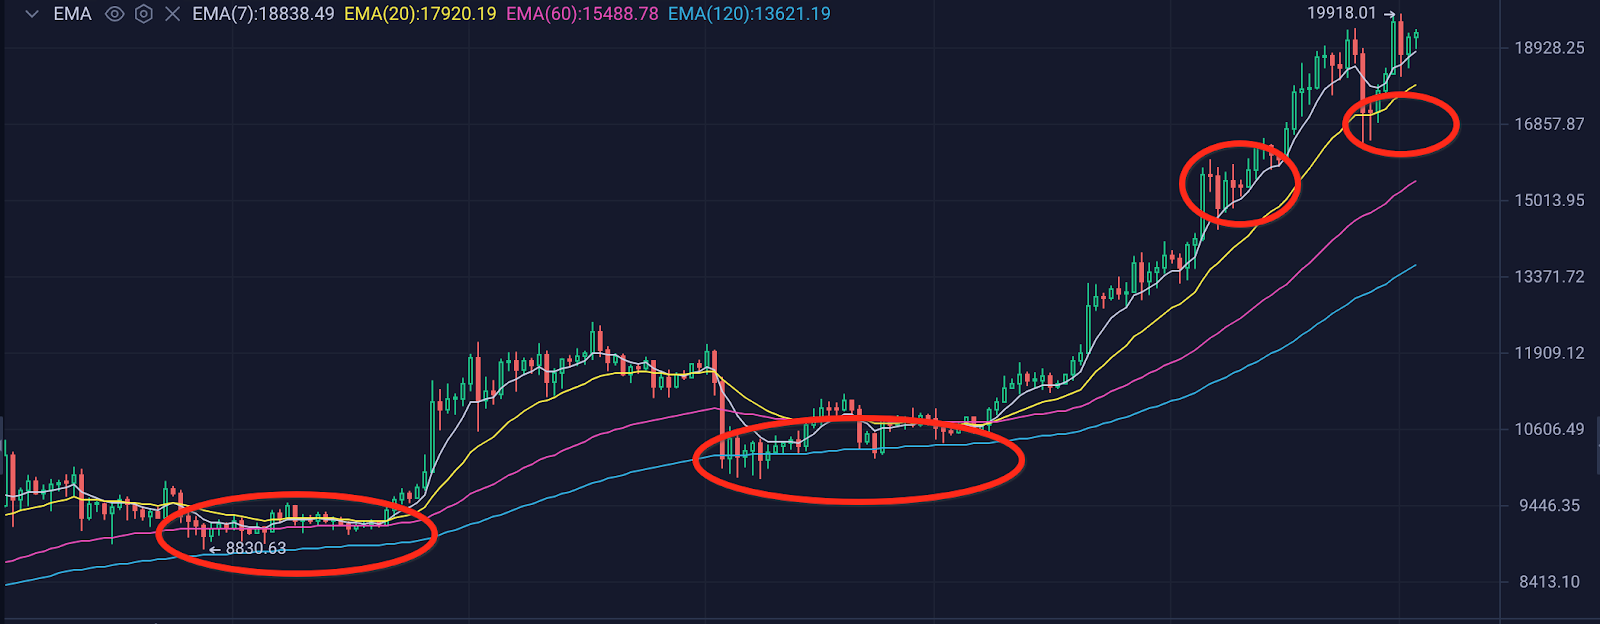
The first step of the EMA strategy is to properly set up your charts with the right EMA lines. The direction of the longer time period EMA line shows the most probable trend. The EMA strategy uses the 7, 20, 60, and 120 periods EMA as shown below. In a typical bull market, the shorter time period EMA is on the top of the longer time period EMA. In the picture below, we see the 7 EMA (white), 20 EMA (yellow), 60 EMA (purple), and 120 EMA (blue) lines. Therefore, every EMA line could be considered a different support level. The second step is to take on a position at the support line.
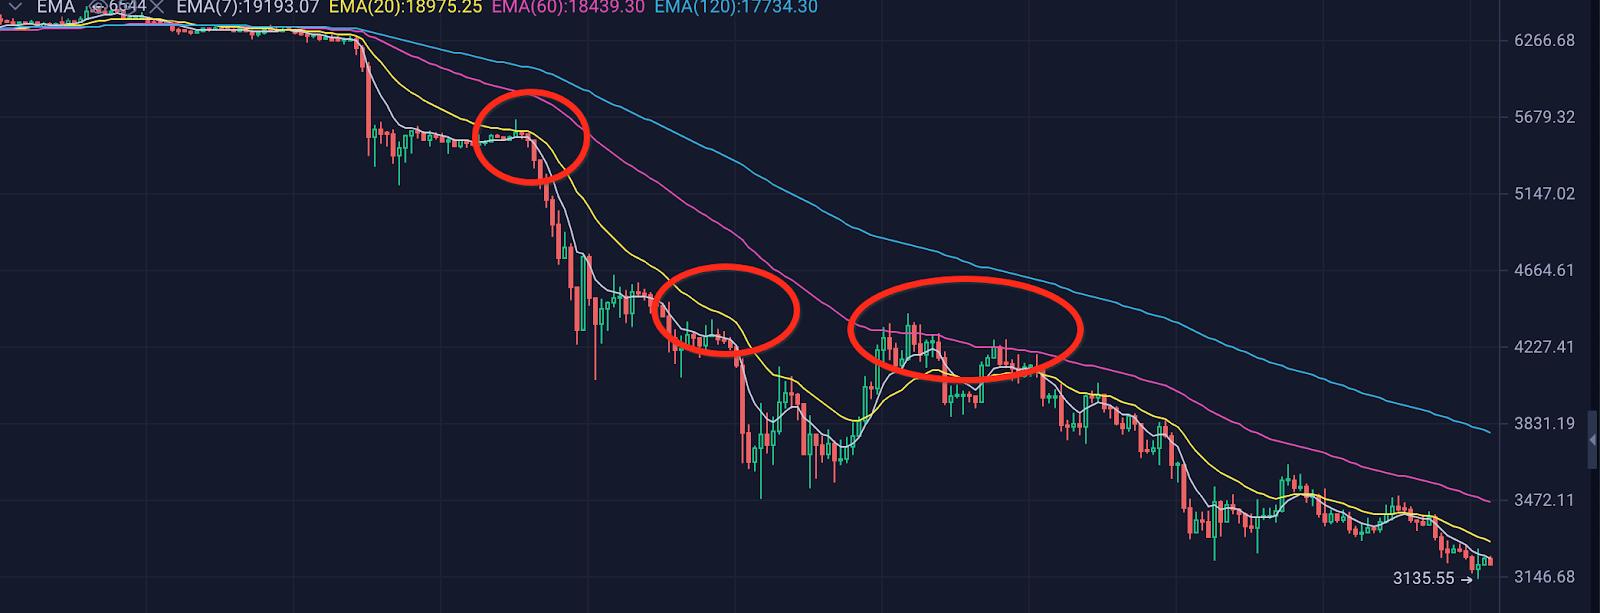
What does the EMA strategy look like in a bearish market? As illustrated in the pictures below, the EMA lines become resistance levels. The longer time period EMA is above the shorter time period EMA lines (120 EMA is on the top and 7 EMA is on the bottom) and provides different resistance levels. If you are holding a long position, you should likely offload some positions at the resistance line.
The EMA is just one of many indicators. If we want to improve the effectiveness of our trading strategy, we need to analyze some additional indicators to reach a final decision, such as the MACD.
MACD Trading Strategy
The MACD trend is considered to be one of the best technical analysis strategies to implement and can serve as a powerful momentum indicator. MACD stands for “Moving Average Convergence Divergence". As the moving average changes over time, is is generally either converging or diverging, which allows for a potentially better predictor for near-term price movements.
Here is what the classical MACD indicator looks like on a chart:
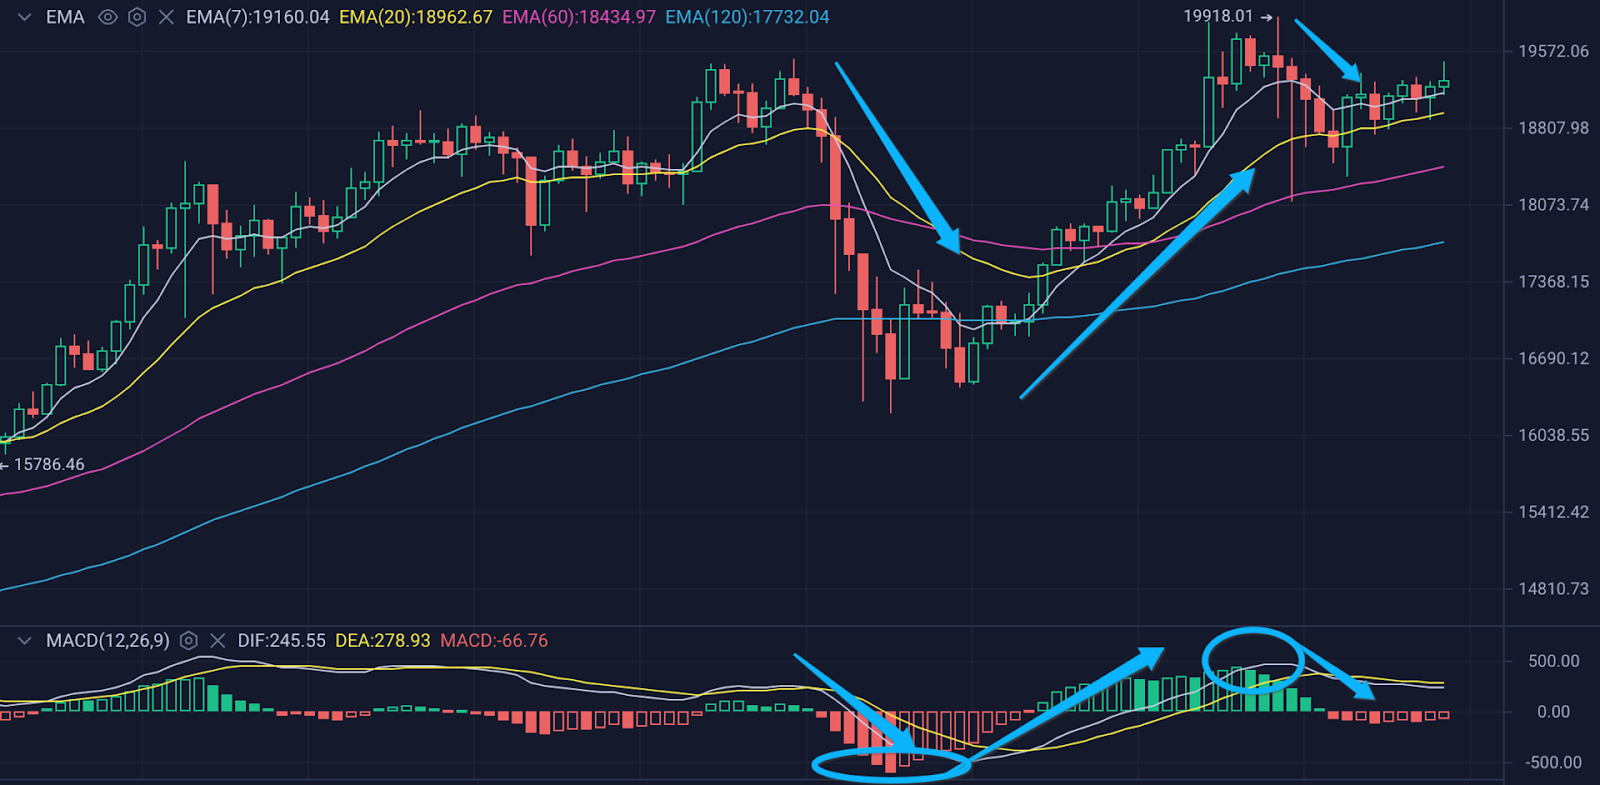
MACD is composed of a series of columns. The slope of consecutive columns illustrates the market trend. Columns above the zero-axis are usually shown in green colors and columns below the zero-axis are normally in red colors. There are several rules to bear in mind when adhering to the MACD strategy:
- Do not sell when MACD is below the zero-axis and do not buy when MACD is above the zero-axis.
- The color of the MACD columns (above/below zero-axis) does not represent the trend but the slope of columns does.
- Buy in when the red column becomes shorter. Sell out when the green column becomes shorter.
Combining EMA and MACD
Single indicators are almost never sufficient on their own, but the combination of EMA and MACD strategies will provide traders with multiple perspectives in order to build a more reliable trading system.
Use the following steps to incorporate your EMA and MACD strategy:
- Plot the EMA system (7-20-60-120) to identify trends and support/resistance levels.
- Plot MACD to identify which level is a turning point.
- Use protective stop-loss (SL) orders. Now that you already know how to enter a trade according to steps 1 and 2, you have to learn how to manage risk and where to place the SL to protect your capital. After all, a trader is in many ways a risk manager. You will want to place your SL below the most recent low, but make sure you add a buffer away from the low to protect yourself from possible false breakouts.
- Take profit when the MACD green columns become shorter.
Before taking profits, it's important to wait for the candle close– either the 4h or the daily candle– depending on the time frame you wish to trade using. This way you ensure that the MACD crossover actually happens.
Closing Thoughts
This article is meant to serve as a basic primer on TA as you embark on your path to becoming a sophisticated technical trader.
Be sure to follow Injective Learn to remain updated on new articles that will provide further information on TA and innovative trading strategies.

About Injective
Injective is a lightning fast interoperable layer one blockchain optimized for building the premier Web3 finance applications. Injective provides developers with powerful plug-and-play modules for creating unmatched dApps. INJ is the native asset that powers Injective and its rapidly growing ecosystem. Injective is incubated by Binance and is backed by prominent investors such as Jump Crypto, Pantera and Mark Cuban.
Website | Telegram | Discord | Blog | Twitter | Youtube | Facebook | LinkedIn | Reddit | Instagram | Orbit Newsletter